Urbanisation
Revised 24 May 2019
Urban population refers to the percentage of people living in urban areas as defined by national statistical offices. The data are collected and smoothed by the United Nations Population Division.
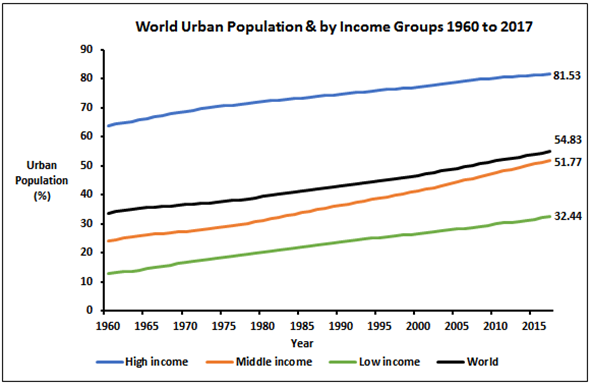
Figure 17: World Urban Population & by Income Groups 1960 to 2017 (Data: United Nations 2019)
Prior to 1960 the group of high-income countries were already highly urbanised (63.8%) and urbanisation continued to increase to 81.5% by 2017. The populations in the group of low-income countries were primarily rural (12.8% urbanised) and over the next 57 years urbanisation increased to 32.4%. The majority of the world’s population in the middle-income countries were also primarily rural in 1960 (24.0% urbanised) and transitioned to a significantly higher level of urbanisation (51.8%) than low-income countries.
Population density is the mid-year population divided by land area in square kilometres.
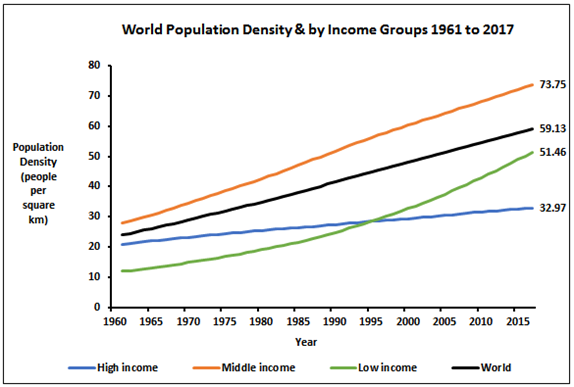
Figure 18: World Population Density & by Income Groups 1961 to 2017 (Data: United Nations 2019)
The low-income countries had the lowest population density in 1960 compared to the middle-income countries (12.0 vs 28.0 people per sq.km.) and these population densities increased to 51.5 and 73.8 people per sq. km. respectively. The degree of both increases in population density follow that of increases in population growth. The population density of high-income countries was mid-way between that of low-income and middle-income countries (21.0 people per sq. km.) and finished up at 33.0 people per sq. km. due to a much lower increase in population over 57 years. A more significant statistic is the ratio of people to cultivatable land as this is a better indicator of a country’s ability to be self-sufficient in food production.