Net Primary Production (NPP)
Revised 24 May 2019
The Net Primary Production (NPP) which is continuously available to herbivores is the sum of the Gross Primary Production less the respiration (R) of the plant. The ratio of respiration to gross production can range from 0.20 to 0.75, depending upon the type of plant. Figure 14 shows an example of the available Net Primary Production available to herbivores.

Figure 14: Net production (Phillipson, 1966, p6)
The photosynthetic efficiency of plants which is the ratio of Net Primary Production to the amount of solar energy received while the plant is in leaf ranges from 1% to 5%. A plant with high photosynthetic efficiency may not necessarily produce more phytomass per unit time than a plant with a low photosynthetic efficiency. The latter plant may have a higher productivity factor as plants have a different ground coverage percentage and not all plants carry out photosynthesis during the entire year. Over one year an average Net Primary Production is approximately 0.25% of the incident solar energy for land plants. Under favourable conditions this may reach 2% over the growing season. Because of these intervening complexities, it is more useful to consider productivity rather than photosynthetic efficiency as a comparison indicator of different plants.
Herbivores feed on the available Net Primary Production. On average they convert approximately 10% of their food intake to growth. The individual Gross Growth Efficiency – (Calories of Growth)/(Calories Consumed) - varies from 6% to 37% among the species. A high Gross Growth Efficiency indicates an efficient assimilation of food energy for growth with little being voided as faeces or used in respiration.
The Gross Growth Efficiency of an organism reduces as the organism grows larger. Another growth factor is the Net Growth Efficiency - (Calories of Growth)/(Calories Assimilated) - where a high Net Growth Efficiency indicates that a relatively small amount of the assimilated energy is lost as heat of respiration and that the remainder is used for growth. Tissue growth efficiencies tend to decrease as one goes up the trophic level food chain. Herbivores, in building up their body tissues, dissipate a large proportion of the phytomass energy they consume. The efficiency of energy transfer between trophic levels – (Calories Consumed by Predator)/(Calories Consumed by Prey) - known as Linderman’s Efficiency is approximately 10%. This efficiency ratio accounts for why the total phytomass of plants is greater than the biomass of herbivores which is greater than the biomass of carnivores. The biomass pyramid in Figure 15 shows this relationship.
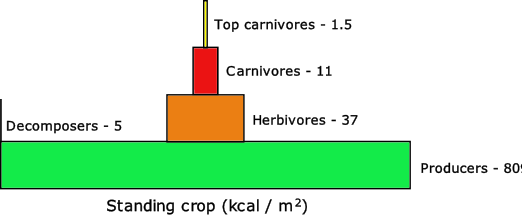
Figure 15: Biomass pyramid (Ehrlich et al, 1977, p134)
Although the biomass of bacteria and fungi accounts for only 0.58% of the community biomass, the following energy flow pyramid in Figure 16 shows that they account for approximately 17% of the energy flow because smaller organisms have a higher metabolic rate in general and reproduce more rapidly than larger ones.
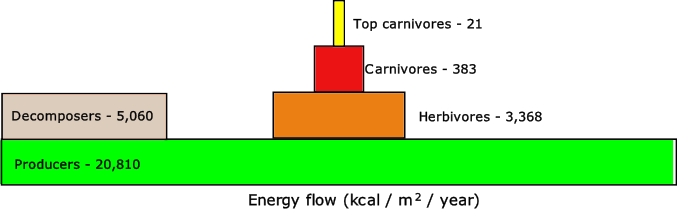
Figure 16: Energy flow pyramid (Ehrlich et al, 1977, p134)