Life Tables & Life Expectancy
Revised 24 May 2019
Average life expectancy at birth is the average number of years that a cohort of new-born infants would live if prevailing patterns of mortality at the time of birth were to stay the same throughout life. The average life expectancy at birth and remaining average life expectancies at each age are estimated using a life table which is based on age-specific crude death rates per 1,000 people of the same age. A typical abridged life table for males and females combined is shown in Table 5 below.
A complete life table contains data for every single year of age from the age of 0 at birth until the age of 100 years. A single row of data is included for those who live longer than 100 years. An abridged life table contains data by intervals of 5 or 10 years of age with an initial interval of 0-1 years to account for infant mortality.
The probability of dying is based on the age-specific crude death rate for each age interval. The radix of the abridged life table, or the initial births at age 0, is set by convention at 100,000 births. The probability of dying is applied to the number of people still alive at the start of each age interval which, in turn, provides the number of deaths within that age interval. The remaining number of survivors shift to the next age interval and calculations of subsequent survivors in each age interval proceed down the column.
Table 5: Example of Abridged Life Table
|
By age |
Probability of dying |
Number of people left alive at age |
Number of people dying |
Person-years lived between ages |
Person-years lived above age |
Expectation of life at age (Years) |
|
0 Years |
0.00274 |
100,000 |
274 |
99,772 |
8,268,809 |
82.7 |
|
1-4 Years |
0.00060 |
99,726 |
60 |
398,769 |
8,169,038 |
81.9 |
|
5-9 Years |
0.00044 |
99,666 |
44 |
498,210 |
7,770,268 |
78.0 |
|
10-14 Years |
0.00041 |
99,622 |
41 |
498,017 |
7,272,059 |
73.0 |
|
15-19 Years |
0.00101 |
99,581 |
100 |
497,685 |
6,774,042 |
68.0 |
|
20-24 Years |
0.00152 |
99,481 |
152 |
497,046 |
6,276,357 |
63.1 |
|
25-29 Years |
0.00210 |
99,329 |
209 |
496,144 |
5,779,311 |
58.2 |
|
30-34 Years |
0.00273 |
99,120 |
270 |
494,954 |
5,283,167 |
53.3 |
|
35-39 Years |
0.00379 |
98,850 |
375 |
493,367 |
4,788,213 |
48.4 |
|
40-44 Years |
0.00563 |
98,475 |
554 |
491,082 |
4,294,846 |
43.6 |
|
45-49 Years |
0.00887 |
97,921 |
869 |
487,594 |
3,803,765 |
38.8 |
|
50-54 Years |
0.01337 |
97,052 |
1,297 |
482,176 |
3,316,171 |
34.2 |
|
55-59 Years |
0.01933 |
95,754 |
1,851 |
474,385 |
2,833,995 |
29.6 |
|
60-64 Years |
0.02784 |
93,903 |
2,615 |
463,374 |
2,359,609 |
25.1 |
|
65-69 Years |
0.04330 |
91,288 |
3,953 |
447,244 |
1,896,235 |
20.8 |
|
70-74 Years |
0.07371 |
87,335 |
6,437 |
422,160 |
1,448,991 |
16.6 |
|
75-79 Years |
0.14001 |
80,898 |
11,326 |
378,386 |
1,026,831 |
12.7 |
|
80-84 Years |
0.25410 |
69,572 |
17,678 |
306,270 |
648,445 |
9.3 |
|
85-89 Years |
0.42124 |
51,894 |
21,860 |
205,263 |
342,175 |
6.6 |
|
90-94 Years |
0.61667 |
30,034 |
18,521 |
100,808 |
136,912 |
4.6 |
|
95-99 Years |
0.79336 |
11,513 |
9,134 |
30,864 |
36,104 |
3.1 |
|
100 Years old & over |
1.00000 |
2,379 |
2,379 |
5,240 |
5,240 |
2.2 |
The number of person-years lived between each age interval are calculated taking into account the spread of deaths during each age interval. This data is then used to calculate the number of person-years lived above an age interval which, when divided by the number of people in that age interval, gives the remaining life expectancy for that age interval. In the example abridged life table, the average life expectancy at birth is 82.7 years. People in the 50-54 age interval have a remaining life expectancy of 34.2 years. The older one lives, the greater are the prospects of living to an age older than the average life expectancy at birth.
A population with a high crude death rate has a corresponding low average life expectancy. With improvements in nutrition and medical care, the crude death rate of a population could decline to as low as 5 deaths per 1,000 people per year and the corresponding average life expectancy of the population would increase to 80 years and older. Figure 12 below shows the world crude death rate and average life expectancy from 1960 to 2016.
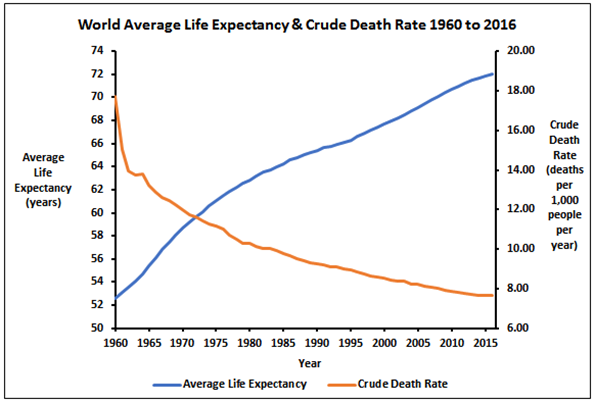
Figure 12: World Average Life Expectancy & Crude Death Rate 1960 to 2016 (Data: United Nations 2019)
The world average life expectancy increased monotonically from 52.6 years in 1960 to 72.0 years in 2016. At the same time the world crude death rate decreased from 17.74 to 7.75 deaths per 1,000 people per year.
Figure 13 below shows the world average life expectancy and rate of change from 1960 to 2016. The most rapid increase in average life expectancy occurred prior to 1967. The rate of increase then continued to decline until 1993 by which time the average life expectancy had improved to 65.9 years. Subsequent improvements to the world total average life expectancy sped up again until 2006 and then slowed down until 2016 when the rate of increase in average life expectancy was 0.25% per year.
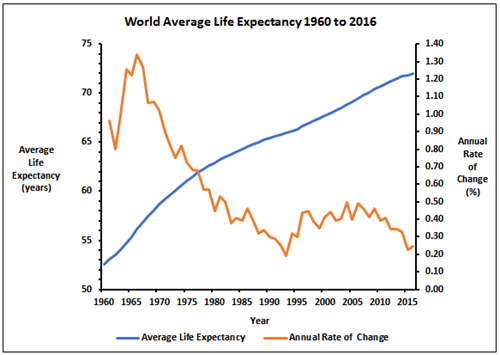
Figure 13: World Average Life Expectancy 1960 to 2016 (Data: United Nations 2019)
Females tend to live longer than males and the average life expectancy of the world female population in 1960 was 54.6 years compared to 50.7 years for males. These average life expectancies improved to 74.3 and 69.6 years respectively by 2016.
The crude death rates in low-income countries tends to be higher than that in high-income countries and this is reflected in the lower average life expectancy. Figure 14 below shows the average life expectancy for combined males and females in high-income, middle-income, and low-income countries.
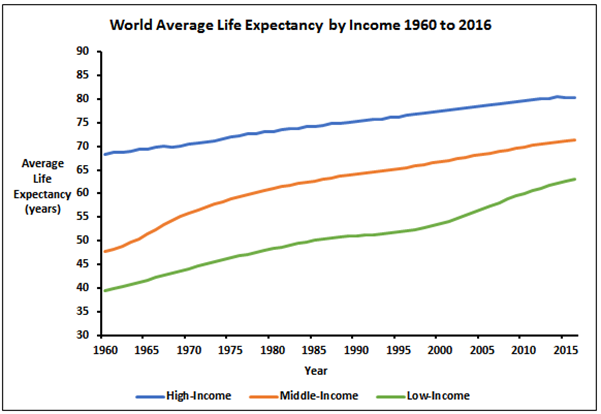
Figure 14: World Average Life Expectancy by United Nations Income Classification 1960 to 2016
(Data: United Nations 2019)
In 1960 the average life expectancy in high-income, middle-income, and low-income countries was 68.4 years, 47.7 years, and 29.5 years respectively. The gap between the average life expectancy in high income countries and that in middle-income and low-income countries was 20.7 years and 28.9 years respectively.
By 2016 the average life expectancy in high-income, middle-income, and low-income countries was 80.4 years, 71.3 years, and 62.9 years respectively. The gap between the average life expectancy in high income countries and that in middle-income and low-income countries had closed to 9.1 years and 17.5 years respectively. Improvements in average life expectancy was due to a decrease in infant mortality, especially in low-income countries, and a general decline in mortality with age.