Introduction
Revised 7 October 2021
Introduction
It is difficult to avoid coming into regular contact with statistics targeted at us by newspapers, magazines, radio, television, websites, and social media. It is even more difficult to be discerning, especially when the original data and methodology used to present statistics to us are not readily available for examination and confirmation. We are essentially left to rely on interpretations of that data by others while misuse of statistics is rife. It is not without foundation that there is a serious mistrust of statistics as promulgated by Disraeli’s quote “There are lies, damn lies, and statistics”.
The misuse of statistics can be due to a lack of understanding of the appropriate tests and statistical methodologies used to analyse data and formulate results. Like the disciplines of science, the discipline of statistics also uses inductive and deductive processes. False or misapplied statistical reasoning constitute a statistical fallacy.
Basic descriptive statistical procedures are frequently misused by non-professionals, but even professionals can misuse simple methods. However, far too frequently there are those with an ulterior agenda who deliberately conceal, obfuscate, or over-interpret results.
A quote attributed to Andrew Lang states "Politicians use statistics in the same way that a drunk uses lamp-post - for support rather than illumination". Good governance requires accurate statistics, but popular governance require support by its electorate. Both left- and right-wing propagandists find ways to massage more palatable statistics. The popular press, in turn, generally has limited expertise in statistics, mixed motives, and cherry pick the statistics that serves their own agendas.
A set of data can be used to provide answers to more than one similar question. This is why different people might draw different conclusions from the same data. Interpretation of data depends very much on the who is doing the interpreting.
Understanding the uses and methodology of statistics is not helpful in ascertaining whether there has been a misuse of statistics unless one has full access to the data and methodology. However, in several cases the misuse of statistics is more obvious provided one knows what warning signals to look for. The balance of this section provides a brief introduction to statistics and recommended resources.
Basic Terminology
Statistics in the plural is the science of collecting, organizing, presenting, analysing, and interpreting data to assist in making more effective decisions.
A statistic in the singular is the interpretation of a fact or piece of data obtained from a study of a large quantity of numerical data.
Descriptive statistics methods include the organisation, summaries, and presentation of data in an informative way.
Inferential statistics includes methods used to find out something about a population based on a sample.
A population is a collection of all possible individuals, objects, or measurements of interest.
A sample is a portion or part of the population of interest.
A frequency distribution is a grouping of data into categories showing the number of observations in each mutually exclusive category.
Probability
Probability is a measure of uncertainty and is concerned with the outcome of experiments or observations where the outcome is unknown. Probability therefore has no meaning for the past because past events have already occurred. The outcome is already known.
Probability refers to propositions about events and not to the events themselves. For example, if we make a proposition that a coin toss will result in a head, then we will be right 50% of the time.
An event which is certain is assigned the probability value of 1 and an event which is impossible is assigned the probability value of 0.
Neither 0 nor 1 measures probability in the non-statistical sense because in everyday experience, probability involves doubt. Anything that is certain or impossible has no degree of probability. The assignment of the probability values of 0 and 1 is for mathematical convenience and the probability of an event is measured as having a value between 0 and 1.
A word of caution. Probabilities should never be assessed intuitively unless that intuition is based on experience.
Sampling
If all members of a population can be measured in some way and there is no missing data or refusals to participate in a survey, then it is possible to directly calculate whatever statistic that is of interest. However, it is impractical to measure information of a total population when that population numbers in the millions. In this case, a random sample of the total population can provide information that is representative of the total population. The sample needs to be large enough and genuinely random without bias in order to provide an accurate statistic which describes the total population within acceptable levels of confidence.
Surveys
Surveys can be biased, and this bias is more obvious if you are the subject of a survey as opposed to the being the recipient of the conclusion of a survey without access to the data and methodology of the survey.
As a subject of a survey, look out for the following:
- Are the questions loaded? Do the questions beg desired answers?
- Are the questions misleading? Are the bases of the questions factual or not?
- Does the ordering of the questions influence your answers?
As a recipient of a survey results without access to the data and methodology of the survey, look out for the following:
- Are the conclusions of the survey presented in an objective rather than biased way?
- Is there a clear intention to report a result at any cost?
As a recipient of a survey results with full access to the data and methodology:
- Are the questions loaded? Do the questions beg desired answers?
- Are the questions misleading? Are the bases of the questions factual or not?
- Does the ordering of the questions influence answers?
- Was the sample randomly selected?
- If participants were selected randomly, but some refused to participate, how were they counted in the analysis? Self-selection bias can arise when some members of a population respond to a sampling request while others do not.
- Were the sample sizes selected large enough for a null hypothesis to be rejected?
- Were unfavourable observations discarded? Did the survey cherry pick favourable observations?
- Was there any bias in the selection process? Samples can be deliberately constructed to prove a particular fallacious argument.
- Can participants self-select into a study?
From the above, it is clear that without access to the data and methodology of a survey, we are reliant on the reputation of the researchers or organisations which conduct surveys to provide unbiased and honest statistics. The independence of the funding of these organisations and their affiliations with other organisation can provide a measure of their reliability.
Controls
When a study is made of the efficacy of one treatment of a medical condition over another, it is critical to know whether the study was single-, double-, or triple-blinded.
A placebo is anything that seems to be a "real" medical treatment, but is not. It could be a pill, a shot, or some other type of "fake" medication or treatment. The belief of patients that they are receiving genuine treatment for their condition can have a powerful influence over whether their condition improves or even fully recovers regardless of whether they have received genuine treatment or not.
A single blind study is where patients do not know whether they are the recipients of a placebo or genuine medication. A double-blind study is where both patients and dispensers of medication do not know what the patients receive. A triple-blinded study is where the patients, dispensers of the medication, and the analyst of the study do not know what the patients have received. Only the principal of the research knows which patients have received placebos and the inclusion and analysis of this information completes the study.
In a peer reviewed publication of a study, both data, methodology, and analysis of the study are available for review. Similar studies can confirm or refute the findings. In some cases, the results of subsequent studies might result in a ‘not proven’ verdict – there is insufficient evidence to support the claim within acceptable levels of confidence.
Normal Distribution
A study is made of the height of adult males using a random sample. Individual heights will vary and these heights can be grouped by numbers into successive intervals of height to form a frequency distribution in table form. This table can be used to create a histogram which uses vertical bars to show at a glance the distribution of the different heights as shown in Figure 1.
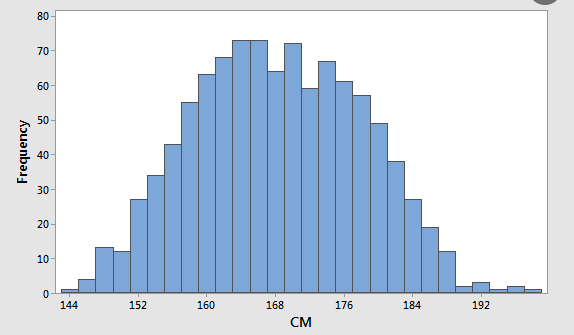
Figure 1: Histogram of heights
A line can be drawn from the midpoint of each bar of the histogram to another bar. If the sample increases in size and the intervals of height are reduced, then the lines will form more closely to a continuous bell-shaped curve called a normal distribution as shown in Figure 2 where the total area under the curve is 1.0.
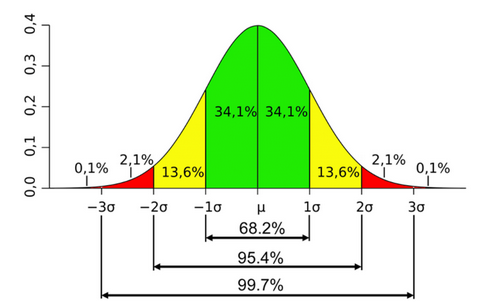
Figure 2: Normal Distribution
A standard deviation using the Greek symbol sigma σ is a measure of how far spread out are the values of the attributes in a population. The Greek symbol mu μ is the mean (or average) of all the values. The frequency distributions of an attribute of many large populations closely follow that of a normal distribution. This property is used to establish the extent that a distribution of a sample varies from that of the population. In a large population, about 68% of people would have a height which falls with one standard deviation from the mean height of the population. This percentage would vary with smaller samples and especially with biased samples. Daylord Moon in his book How to Catch LIes with Statistical Distributions describes how to test for the validity of statistical claims by comparing the distributions of samples against that of a normal distribution. Similar methods have been used to reveal spurious accuracies of an experiment.
Measures of Central Tendency
Measures of central tendency provide information as to what is a typical value of an attribute of a sample or population. The most common measures of central tendency are the arithmetic mean, median, and mode.
The arithmetic mean, or simply the mean, is the sum of all values of a data set divided by the number in the sample or population. The mean is commonly known as the average.
The median of a data set is the middle value when the values are ranked in ascending or descending order.
The mode refers to the most frequently occurring value in a data set.
The mean should never be accepted as being significant without also knowing the range between minimum and maximum values, the median, and the mode values. In a normal distribution, the values of the mean, median, and mode are one and the same. The distribution of the values of an attribute of a sample or population can be skewed. A typical example is the distribution of wealth in a population where a major proportion of the population is on a much lower income than a small proportion of the population on a very high income. In Figure 3, income is plotted along the horizontal x-axis and the proportion on each income interval is plotted on the vertical y-axis. The high income of a minority of the population raise the mean income of the population above the median income of half the population. In this case, the distribution is positively skewed. To refer to only a mean income in this instance would be highly misleading and more so with greater degrees of inequality in income.
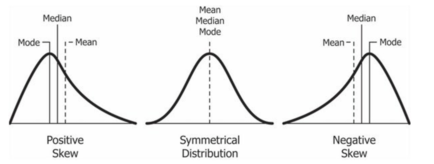
Figure 3: Positive and negative skewed distributions versus symmetrical distribution
Correlation Cause and Effect
When a statistical test shows a correlation between the data sets A and B, there are usually six possibilities:
- A causes B.
- B causes A.
- A and B both partly cause each other.
- A and B are both caused by a third factor, C.
- B is caused by C which is correlated to A.
- The observed correlation was due purely to chance
It does not logically follow there is a causal relationship between two things just because the two things are associated or are correlated. The only way to find out with any degree of certainty whether there is an actual causal relationship is by conducting controlled experiments. This is not always possible for practical or ethical reasons or where only historical observations and data are available.
One set of data alone will rarely, if ever, indicate the existence of a causal relationship; a mass of evidence win be needed for this purpose. Extraordinary claims of a causal relationship required extraordinary evidence.
Where no direct causal relationship can be established between two correlated variables, their correlation cannot be used as evidence to support the proof of any proposition.
Correlation coefficients are expressed in values ranging between -1 and +1. A negative correlation means that one thing is increasing while the other decreases. The closer a correlation coefficient is to both extremes, the greater is the degree of correlation, but the significance of a correlation coefficient is highly subjective. For example, some economic theories are backed up by a correlation coefficient of 0.5. In another discipline, this level of correlation would be regarded as being weak. When two things have a history of growing exponentially, it is of no consequence that there would be a correlation between these two things.
A regression line which describes a purported functional relation can be plotted against observed values on a chart. Never accept a regression line which omits the observed values. The absurdity of a significant correlation claim is immediately revealed when the observed values are included on a chart.
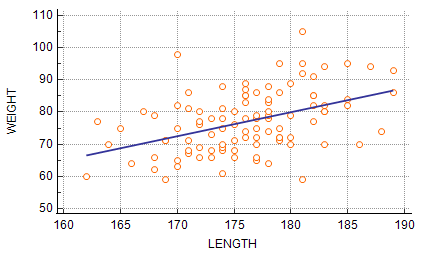
Figure 4: Scatter diagram with regression line
Resources
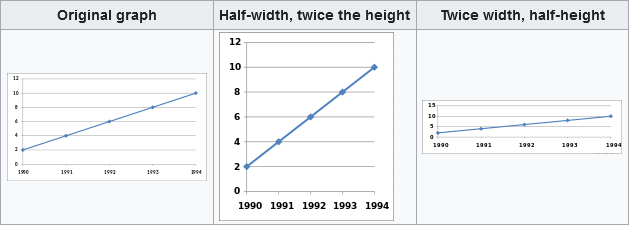
Wikipedia provides an excellent summary of misleading charts (link here). A sample chart is shown below.
There are several excellent books on the misuse of statistics. W.J. Reichmann’s book, The Use and Abuse of Statistics (1962) is a classic.