Age Composition
Revised 23 August 2021
When forecasting the future size of a population, the changing age composition of the population must be taken into account. Figure 7 below shows the age compositions of two idealised populations in a stack of cohorts by age: one that that has undergone continuous rapid annual growth and one that has achieved stationary and steady state ZPG. The rapid growth population has been set to grow exponentially at the constant rate of 2.0% per year for a period of more than 100 years and the fertility and mortality of the population during this period has been set to remain static.
The mortality of the ZPG population is based on the mortality of the New Zealand population in 2014-2016 where the average life expectancy of males and females were 80 and 83 years respectively (Statistics NZ, 2016). This mortality has been set to remain constant for over 100 years in the ZPG population. For the sake of comparison, the mortality of the continuous rapid growth population has also been set to the same mortality. In practice, rapid growth populations tend to have high crude death rates with a subsequent low average life expectancy. For example, the crude death rate of Nigerians in 1960 was 26.4 deaths per 1,000 people per year with a corresponding average life expectancy of 37.0 years for males and females combined (United Nations, 2019). These statistics improved to 12.5 deaths per 1,000 people per year and an average life expectancy of 53.4 years by 2016. Average life expectancy is addressed in more detail in a section below.
The rapid growth population has a triangular spear shape profile which is typical of a country with a high crude birth rate. As females from a birth cohort rises up the stack of age cohorts into the child-bearing age rank of cohorts (ages 15 to 44), each subsequent rank of child-bearing cohorts give birth to more children than previous ranks. More children are born each year and the population continues to grow exponentially.
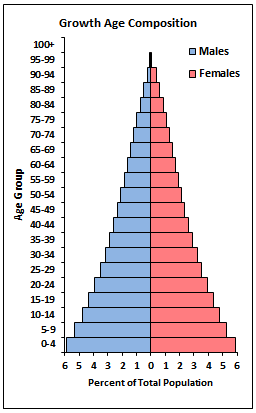
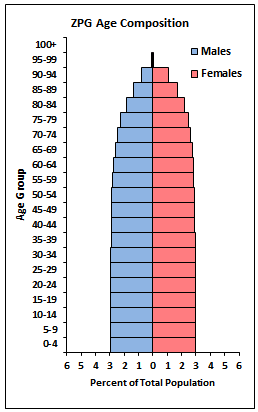
Figure 7: Age Composition in a Growth & ZPG Population
The profile of the rapid growth stack of cohorts by age composition is commonly referred to as a pyramid. This expression is a misnomer if applied to the ZPG population. The ZPG population has a tapering cylindrical shape profile which is typical of a country with a low crude birth rate. The tapering is due to progressive mortality with age resulting in a larger proportion of departures (deaths) from each older cohort. Mortality becomes more absolute at the higher age cohorts, hence closure of the tapering at the age of 100 with only a few in the population surviving beyond 100 years.
A transition of the world population to a ZPG population can be described as taking place over 4 stages.
- In stage 1 both crude birth and death rates are high with a slightly higher crude birth rate resulting in a very slow growth rate.
- In stage 2 the health of the world population starts to improve and mortality declines. Fertility remains at the same high level, so growth in the population starts to increase rapidly.
- In stage 3 social changes take place and families choose to have fewer children. Effective contraception becomes available and women become emancipated taking charge of their own reproduction. More women enter the work force rather than staying at home to raise a large family and total fertility subsequently declines. The growth rate of the population slows down, but the population continues to grow due to population momentum which is addressed in more detail in a section below.
- In stage 4 the age composition of the population eventually stabilises, by which time the population has reached ZPG.
In a ZPG population there are more adults over the age of 65 than children under the age of 15. In a transition from a growth population to a ZPG population, the ratio of the number of dependents under the age of 15 and over the age of 65 to the number of working age from 15 to 64 changes. This change in ratio is described in more detail below.
In an idealised text book description of ZPG population, the fertility and mortality of a population are both static and the age composition of the population remains stationary without change. In practice, fertility and mortality from year to year undergo fluctuations, but from generation to generation the size of a ZPG population would remain more or less unchanged. In a ZPG population, the size of any cohort would be smaller than a younger cohort. This would not be the case when the fertility and/or mortality of a population undergo major changes or when a population transitions from growth to ZPG.
An example of a major change in fertility is the population of China. In 1978, Chinese women had 2.94 children on average compared to the world average of 3.85 children (United Nations, 2019). In 1979 China adopted a one child per family policy. This policy was discontinued in 2016 when China adopted a two-child policy. By 2015 Chinese woman had 1.62 children on average compared to the world average of 2.45 children.
The one-child policy had a dramatic and lasting impact on the age composition of the Chinese population as shown in Figure 8 below.
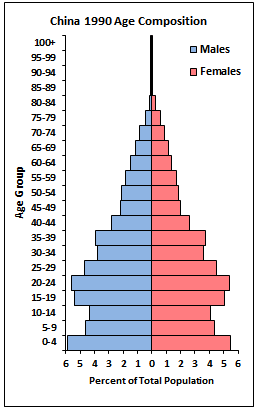
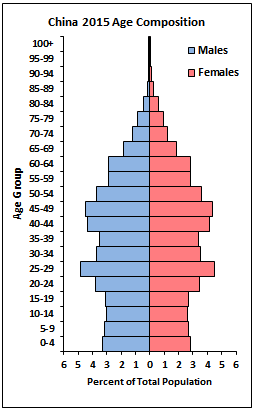
Figure 8: Age Composition of China in 1990 & 2015 (Data: United Nations 2019)
In the mid-1980s the one-child policy was modified to allow families in rural areas to have two children if the first child was female. There were also other exceptions to the one-child policy. Between 1979 to 2015 about 50% of Chinese families had two children rather than only one child or no children. The impact of the one-child policy can be seen in the reductions in births of the 0-4 age cohort moving up the age composition stack of cohorts over time.